gordon.dewis.ca - Random musings from Gordon

Subscribe

Archive for the ‘Statistics’

Are Ottawa’s winters less snowy? It depends on how you look at it.

January 26, 2012 @ 21:12 By: gordon Category: Statistics, Weather

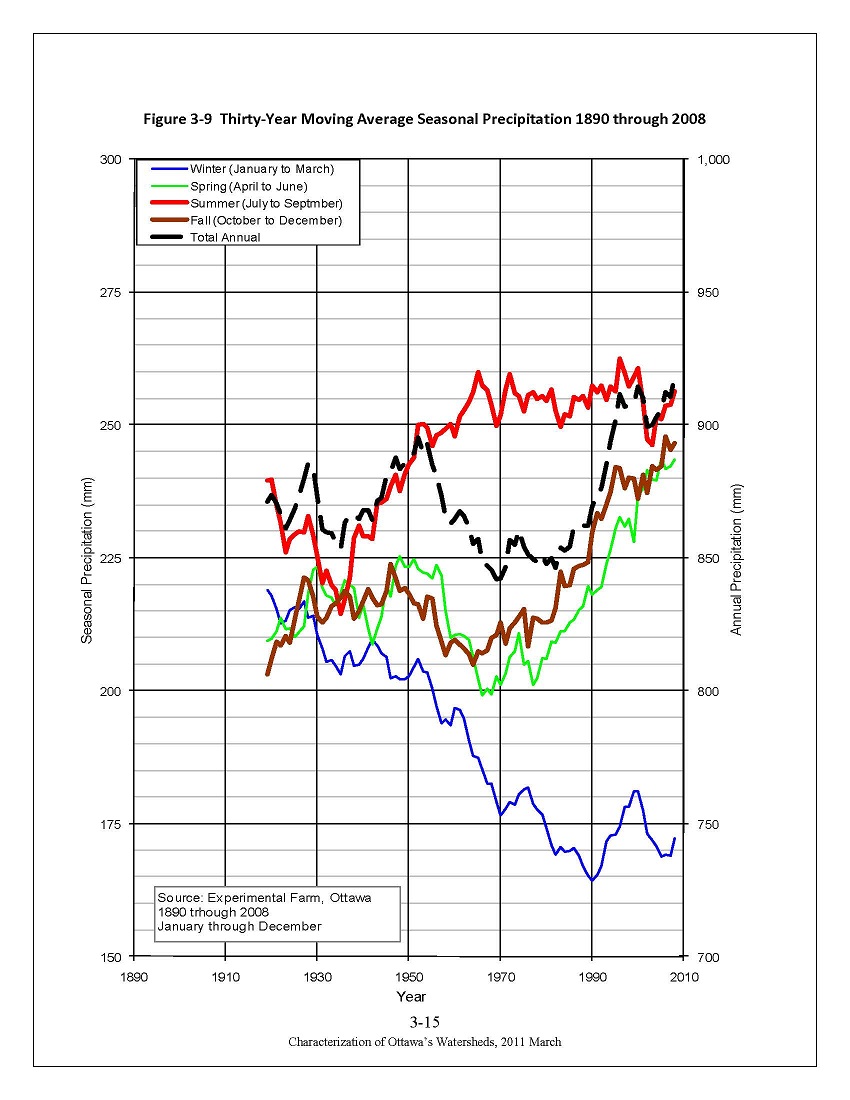
Charles over at Guide Gatineau posted an interesting article this morning looking at the implications of climate change on skiing and snowshoeing in the Ottawa area. He included a graph showing a the 30-year moving average of seasonal precipitation recorded at the Experimental Farm between 1890 and 2008. He asks “Do my eyes deceive me or does it look to you as if today we get only something over 1½ metres”, and based on the graph at first glance he’s not wrong — in the last few years we’ve averaged around 160cm of snow per winter.

Looking at the graph in question, it does appear that there has been less snowfall recorded at the Experimental Farm’s weather station recently compared to the start of the record, though the total annual precipitation, including both rain and snow, shows an upward trend over time. There are many factors that could be affecting the snowfall accumulation data. For example, over the years the Experimental Farm has gone from being in a rural setting to an urban setting by virtue of the fact that the city has grown around it. If the weather observation site had remained in a rural environment, the snowfall record might be quite different. Trees and buildings around the Farm have gotten bigger over the years, which probably has had an impact on the wind patterns at the Farm. This could result in less drifting snow, which could result in less accumulation.

Another thing about the graph is that seasonal precipitation is reported in millimetres. Presumably, they’re using a 10:1 conversion factor for snow:water, though they could have melted a column of snow and recorded the actual amount of water — either method is fine for our purposes. The blue line represents January to March precipitation, most of which is probably snow, but could be rain or some other type of precipitation like hail. The brown line represents October to December and this is where things get a bit problematic because there’s a fair chance that precipitation in those months can be a mix of rain and snow. Without a distinction between rain and snow, we have no way of knowing how much snow we should be adding to the snow calculated from the blue line to get a reasonable estimate of the total snowfall. In other words, using just the blue line to calculate the amount of snow results in under estimation.

Intrigued by Charles’ graph, I decided to do my own analysis using monthly weather data from Environment Canada’s Climate Data website. The results are interesting and tell a slightly different story from the data in the graph from the Experimental Farm.

(more…)

Geocaching in 2011: Perception vs. Reality

December 05, 2011 @ 12:38 By: gordon Category: Geocaching, Statistics

Though I’ve been geocaching for a long time, my number of finds is quite a bit less than some geocachers I know who haven’t been caching nearly as long as I have, but who have several thousand finds. But, for me, it’s not about the numbers.

I was thinking about how much caching I’d done this year compared to last year and that I hadn’t done that much caching this year. But, when I looked at the stats, I found a completely different story.

First, the graph (red line=caches found in the year; blue line=cumulative caches found):

(more…)

Happy World Statistics Day!

October 20, 2010 @ 11:20 By: gordon Category: Current affairs, General, Statistics

The United Nations General Assembly has proclaimed today to be World Statistics Day.

To quote from the UN Statistics Division’s website,

The celebration of the World Statistics Day will acknowledge the service provided by the global statistical system at national and international level, and hope to help strengthen the awareness and trust of the public in official statistics. It serves as an advocacy tool to further support the work of statisticians across different settings, cultures, and domains.

National statistics concern everyone to one degree or another. They contribute significantly to our knowledge of how well we’re doing as a country and they play a vital role in the creation of economic and social policies. The seemingly simple question "how large is a country’s labour force and what is its composition?", for example, can only be answered using data collected by a national statistical agency.

As one of the thousands of people around the world who work for the various national statistical agencies in the world, I’m proud of the role I play, however small it may be, in contributing to the better understanding of the world we live in.

Enforcement statistics for the first two years of Ottawa’s Idling Control by-law

March 24, 2010 @ 12:44 By: gordon Category: Environment, Statistics

My recent entry reminding people that the temperature during the days lately have been such that the Idling Control by-law (Bylaw #2007-266) got me wondering about how often people have been ticketed for violating it, so I asked the City of Ottawa for the statistics.

(more…)

Z, Y, X, … uh… Q … no wait… J! … uh… uh…

December 30, 2009 @ 11:22 By: gordon Category: Statistics, Wii

Can you recite the alphabet backward? If you can, then you are in the minority according to the Wii Bureau of Statistics.

According to the results of the question on the Wii Everybody Votes Channel, only 32.1% of Canadian Wii users said they could, while 67.9% said they couldn’t, which surprised me because I don’t think it’s that difficult.

Question: Can you recite the alphabet backward?

  Yes No
Nationally 32.1% 67.9%
Male 32.8% 67.2%
Female 30.5% 69.5%

National prediction accuracy: 71.5%

Union support at fourteen percent

January 07, 2009 @ 07:30 By: gordon Category: Current affairs, Statistics, Transit strike

fourteen-percent The mayor released the results of a survey conducted by Harris/Decima that asked city residents about the transit strike on his blog Tuesday. There’s a fair bit of detail in the results, so I thought I’d highlight a few numbers.

Overall, 63% moderately or strongly support the City while only 14% moderately or strongly support the Union. (Eighteen percent of people support both equally.)

While 14% of people have sided with the union, only 8% of people are satisfied with with way the union has handled the negotiations, compared to 36% who are satisfied with the city’s behaviour. Most people think the city is “being fair and reasonable with the transit union in its approach to the issues”.

It gets more interesting… (more…)

Mind versus Body

July 26, 2008 @ 10:27 By: gordon Category: Statistics, Wii

The results of a question asked on the Wii Everybody Votes Channel recently suggest that we Canadian Wii players are an intellectual bunch.

Question: Which is more important to exercise daily…

  …your mind? …your body?
Canada 52.5% 47.5%
Males 51.0% 49.0%
Females 55.5% 44.5%

National prediction accuracy: 41.7%